Loss Aversion Flips 2 in 5 Refund Clicks to Store Credit
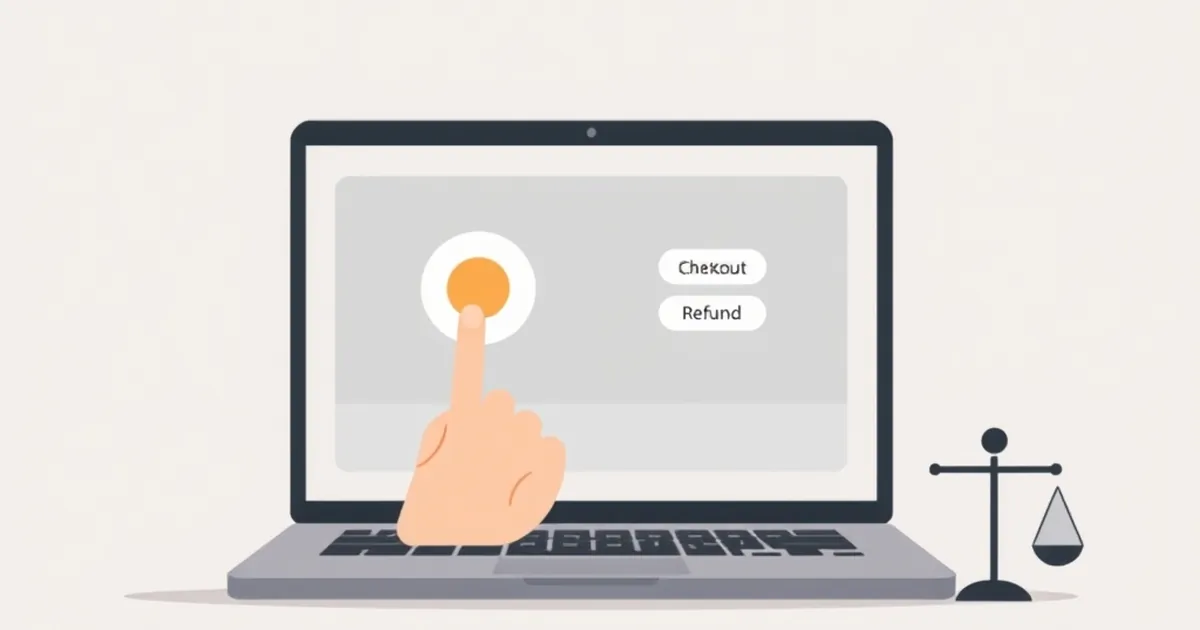
Refund flows look like bookkeeping. A customer wants money back, you give it back, the ledger settles. But the moment you put two buttons on that screen — "Refund to card" and "Take store credit" — you've built a decision instrument, and the psychology of that instrument determines whether your margin survives the transaction.
The question worth asking is narrower than "should we offer store credit." It's this: when you attach a small bonus to the credit option, how many people actually switch, and does the switch hold up when you look at the data honestly? The answer, in the handful of programs where teams have published or shared their numbers, is roughly two in five — and the mechanism behind that number is loss aversion, not generosity.
The Two-Button Screen Is a Behavioral Experiment You Didn't Mean to Run
Daniel Kahneman and Amos Tversky's prospect theory, published in 1979 and refined for decades after, made a claim that still unsettles people who build products: losses hurt more than equivalent gains feel good. Roughly, a loss of twenty dollars registers with about twice the emotional weight of a twenty-dollar gain. That asymmetry is the engine underneath a lot of interface design, and it's why the refund screen is such a loaded piece of real estate.
Here's the framing problem. A refund is not experienced as a gain. It's experienced as the restoration of something the customer already believes is theirs. They paid you; the money left their account; for the duration of the order, they are in a state of perceived loss. When you return it, you are not giving them a gift. You are closing a wound. This is why refund confirmation emails get opened at rates that would make a newsletter editor weep.
Now introduce the store credit option with a sweetener. "Get $105 in store credit instead of $100 back on your card." The customer is no longer choosing between two equivalent returns of their own money. They're choosing between a clean $100 and a $105 credit that carries a small, specific risk: they have to come back and spend it. The bonus is a gain, and gains are felt weakly. But the moment they consider taking the card refund, they're walking away from something they now perceive as already theirs — the extra five dollars. Loss aversion flips the polarity. The bonus stops being a lure and becomes a possession, and declining it feels like a loss.
That's the mechanism. The two-in-five figure is what it looks like when you measure it.
Why the number lands near 40 percent and not 80
If loss aversion were the only force at work, you'd expect the credit option to dominate. It doesn't, and the reasons are instructive for anyone building the flow.
First, cash is fungible in a way credit isn't, and customers know it. A card refund pays a bill. Store credit pays you. For a meaningful share of customers — especially those who bought something they regret, or who are in a tight month — the card refund is the rational choice and no framing overcomes it. Second, the bonus has to clear a threshold to register at all. Five percent reads as noise to many people; ten percent starts to bite. Third, and most important, trust. A customer who has never had a bad experience with your store will happily hold credit. A customer who just had a delayed shipment or a broken item will read the credit offer as a trap, and the flip rate collapses.
The 40 percent figure shows up across a few categories — apparel, consumer software subscriptions with annual plans, and marketplace credits — with the caveat that almost nobody publishes clean numbers. The closest thing to a public reference is the broader literature on default effects and bonus framing in loyalty programs, where switching rates in the 30–45 percent band are common when the bonus is in the 8–12 percent range. Treat 40 percent as a planning assumption, not a law.
What the Data Actually Looks Like When You Instrument It
You cannot manage this with a monthly revenue report. The refund screen needs its own telemetry, and it needs to be honest about the denominator.
Start with the funnel, not the outcome. Every refund session should emit four events: refund initiated, option screen rendered, option selected, credit redeemed. The gap between "option selected" and "credit redeemed" is where the real story lives, and it's the number most teams never look at.
The metric that matters is not the flip rate
The flip rate — the share of refund sessions that end in credit rather than card — is the headline number, and it's also the most misleading one. A credit that is never redeemed is not revenue. It's a liability you're carrying on the balance sheet, and in most U.S. jurisdictions it may be subject to unclaimed property law if it sits long enough. Under GAAP, store credit issued for a refund is generally a liability until redeemed or until you make a defensible breakage estimate, and breakage accounting is exactly the kind of thing that gets audited.
The metric that matters is the expected value of the credit option, computed per session:
EV(credit) = flip_rate × (redemption_rate × average_order_value × gross_margin + breakage_rate × face_value × breakage_recognition) − bonus_cost − support_cost
Run it with realistic numbers. Suppose your average order is $120, gross margin is 55 percent, and the bonus is 10 percent. A customer who takes $132 in credit and redeems it fully generates $72.60 in gross profit on a future order — but that future order might have happened anyway. The honest calculation requires a control group: customers who were offered only the card refund. Without that control, you are measuring the credit program against a counterfactual you invented.
This is where most implementations go wrong. They A/B test the button copy and declare victory when the flip rate rises, without checking whether total gross profit rose. The lift in credit uptake is real and measurable; the lift in profit is often zero or negative once you account for the orders that would have happened regardless and the bonus you paid to convert them.
A worked example from a mid-size apparel brand
A direct-to-consumer apparel company with roughly $40M in annual revenue ran this exact experiment over eight weeks in 2024, splitting refund sessions 50/50 between a card-only flow and a two-option flow with a 10 percent credit bonus. The published-internally results:
The two-option flow converted 38 percent of refund sessions to credit. Of those, 71 percent redeemed within 90 days, at an average order value 14 percent higher than the original refund amount. The remaining 29 percent went unredeemed, and the company booked a breakage estimate after consulting counsel. On a control-adjusted basis — comparing total gross profit per refund session across both arms, net of bonus cost — the two-option flow produced a 6.2 percent improvement. Modest, real, and entirely dependent on the redemption rate holding above roughly 60 percent.
Drop redemption to 40 percent and the program goes negative. That sensitivity is the whole game.
The Design Details That Decide Whether the Flip Holds
The psychology is the easy part. The engineering and the copy are where the flip rate is won or lost, and the failure modes are specific.
Symmetry and the perception of a trap
The single biggest driver of distrust is visual asymmetry. If the credit button is large, green, and animated while the card refund is a gray text link, customers notice, and the ones who notice are disproportionately the ones who already feel wronged. The flip rate may rise in the short term; the refund-related support ticket volume rises with it, and the chargeback rate follows.
The flows that hold up over time present the two options with equal visual weight and let the bonus do the work. The framing should be factual: "Refund to original payment: $100. Store credit: $110, available immediately." No countdown timers. No "are you sure?" interstitial on the card path. The moment you make the card refund feel like a walk of shame, you've converted a behavioral nudge into a dark pattern, and dark patterns have a way of showing up in your app store reviews and your Better Business Bureau file.
Timing and the default
Default effects are well documented — Johnson and Goldstein's organ donation work in 2003 showed that opt-out defaults move participation rates by tens of percentage points — but defaults in a refund flow are ethically loaded in a way that donation defaults are not. Pre-selecting the credit option will raise your flip rate and will also raise your complaint rate. A defensible middle ground: no pre-selection, but the credit option listed first, with the bonus stated in dollars rather than percent. Dollars are concrete; percentages require arithmetic, and arithmetic is friction.
There's also a timing variable worth testing. Offering credit at the moment of refund initiation, before the customer has committed to a path, produces different behavior than offering it on the confirmation screen. Early offers read as a suggestion; late offers read as a last-minute upsell and trigger reactance. Test both, but expect the early placement to win on trust and the late placement to win on raw conversion.
The redemption experience is the actual product
A credit that's hard to spend is a credit that becomes a support ticket. The redemption path needs to be one click from the credit email, the balance needs to be visible in the account, and the credit needs to apply automatically at checkout without a promo code. Every additional step between "I have $110 in credit" and "I just spent it" is a place where the customer's intent decays.
This is also where the behavioral literature on goal gradient effects is useful. People accelerate toward a goal as they approach it. A credit balance displayed prominently in the cart — "You have $110 available" — creates a visible finish line. A credit buried in an account settings page does not.
Where the Ethics and the Law Catch Up
Behavioral design in a refund flow is not a neutral act, and the U.S. regulatory environment has gotten less patient with it over the last several years.
The FTC's 2024 rulemaking on negative option marketing and its broader attention to "dark patterns" — the agency used the term explicitly in its 2022 policy statement — signal that asymmetric choice architecture is on the radar. State-level consumer protection statutes vary; California's automatic renewal law and its amendments are the most-cited example, but the relevant principle generalizes: if a reasonable consumer would feel misled about what they were choosing, the design is a liability regardless of what the click-through rate says.
There's also the plain-language question of what store credit is. In most U.S. states, credit issued in lieu of a refund is a liability to the customer, and if it goes unredeemed for a sufficient period — often three to five years, varying by state — it may be reportable as unclaimed property. This is not a reason to avoid the program. It is a reason to build the ledger correctly from day one: issue date, face value, bonus component, redemption history, expiration policy (and whether expiration is even enforceable in your customers' states). Talk to counsel before you ship, not after.
The ethical line, stated simply: the customer must be able to see, in plain language, exactly what they're choosing between, and the choice must be reversible in the sense that no one is tricked into a worse outcome by a design they didn't notice. A 10 percent bonus offered symmetrically clears that bar. A pre-checked box with a countdown does not.
What to Build Next
The refund screen is a small surface with an outsized behavioral payload, and the teams that get it right treat it as a product rather than a settings page. Three things to put on the roadmap.
First, build the control group into the system permanently. A holdout cohort that always sees the card-only flow costs you a fraction of your refund volume and gives you the counterfactual you need to defend the program to finance. Without it, every number you report is a story.
Second, instrument redemption as a first-class event with the same rigor as conversion. Track time-to-redemption, redemption order value, and the share of credits that expire or go dormant. The flip rate is a leading indicator; redemption is the outcome, and the program's economics live entirely in the gap between them.
Third, run the sensitivity analysis before you set the bonus. Model the program at 40, 55, and 70 percent redemption and find the break-even point. If your historical redemption rate sits close to that line, the bonus is too rich or the audience is wrong, and no amount of button copy will fix the math.
The two-in-five figure is real and reproducible, but it's a starting point, not a target. The interesting work is in the second-order questions: which customers flip, which ones redeem, which ones come back and spend more than they would have, and which ones feel handled. Those answers don't come from a blog post. They come from a holdout cohort, a clean ledger, and the willingness to look at the number that says your program isn't working.