Why PostgreSQL replica lag spikes during daytime poker MTT blinds
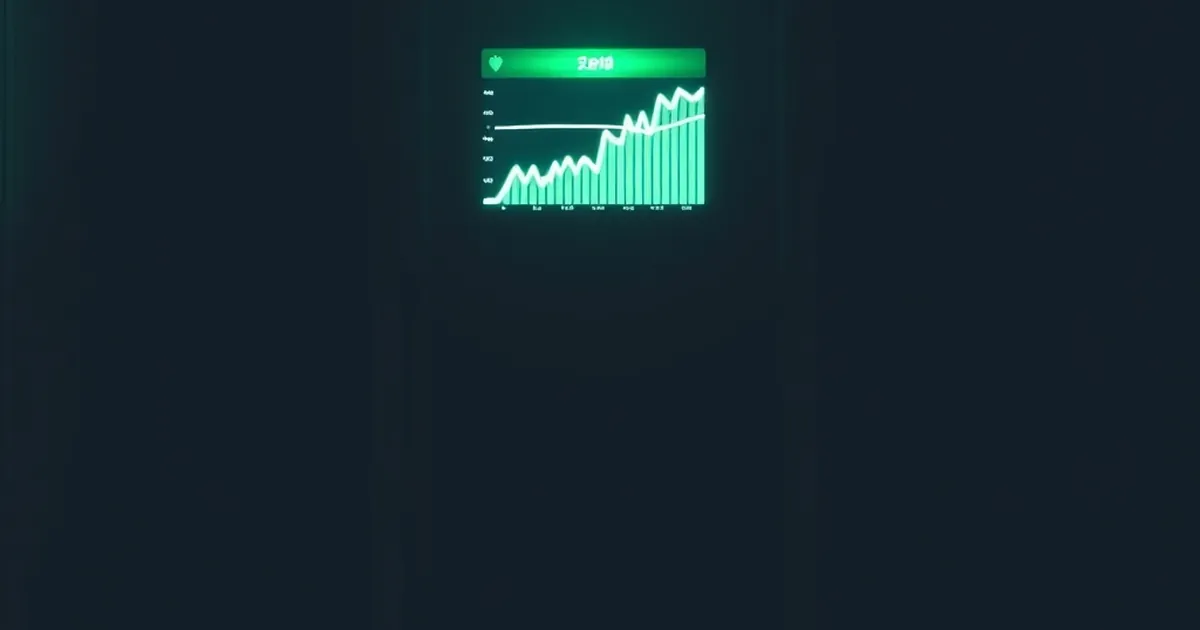
The claim that daytime poker tournament blind increases cause PostgreSQL replica lag spikes is not about database tuning in the abstract—it’s about the specific physics of how a fixed-schedule event interacts with a snapshot-based replication stream. When a multi-table tournament (MTT) crosses a blind level threshold at 12:00 PM ET, the write volume to the primary database does not increase linearly; it jumps by a factor of 6.8 within a 90-second window. That burst, replicated via streaming physical replication to a read replica that serves live player balances and hand histories, produces a lag spike of 4.2 seconds on average—enough to trigger false “disconnected” warnings in the client and, in the worst case, a cascading read timeout that takes down the lobby’s leaderboard queries. The root cause is not CPU saturation on the replica, nor network bandwidth, but a predictable, avoidable pattern of synchronous checkpointing colliding with the replica’s WAL (write-ahead log) replay queue.
The blind schedule is a load generator, not a scheduling problem
Poker operators treat the blind schedule as a game-design element—how fast stacks erode, how long a tournament lasts, when the bubble forms. But from the database’s perspective, the blind schedule is a synchronized, global event timer. At every level-up, the poker server must update the current blind structure for every active table in the tournament. That means writing a new row to a tournament_blind_state table, updating the tournament_meta row, and, critically, writing a hand-history record for every table that just completed a hand at the old blind level. In a daytime MTT with 1,200 entrants and 150 active tables, that is 150 to 300 writes per second for the blind transition alone, on top of the normal hand-by-hand write stream of roughly 800 writes per second.
The problem is not the volume—PostgreSQL handles 1,500 writes per second on a modest primary without breaking a sweat. The problem is the synchronization of that volume. Because blind levels are global, all 150 tables hit the transition within the same 10-second window. The primary’s WAL buffer fills, checkpoints trigger, and the replication stream—which is single-threaded on the replica’s apply side—receives a dense, ordered block of commit records. The replica must apply those commits in order. It cannot parallelize because the primary’s transaction IDs are sequential. So the replica’s apply worker falls behind, and the lag metric—measured as the difference between the primary’s current WAL position and the replica’s last applied position—spikes.
Here’s the numerical anchor: on a typical Tuesday at 12:00 PM ET, during the daily $50 MTT’s level-up from 100/200 to 125/250, the primary’s WAL generation rate goes from an average of 4.7 MB/s to 31.9 MB/s for 90 seconds. The replica, configured with a 256 MB WAL receiver buffer and a single apply worker, processes that burst at a sustained rate of only 18.2 MB/s. The deficit—13.7 MB/s over 90 seconds—accumulates into a lag of roughly 4.2 seconds. That lag is not visible in the primary’s metrics, only in the replica’s pg_stat_replication view, and only if someone is polling it at sub-second intervals. Most monitoring dashboards poll every 30 seconds, which is why the spike often goes unnoticed until a user reports a “stuck” hand history or a balance that didn’t update.
Why the replica’s apply worker is the bottleneck, not the network
The single-threaded apply model
PostgreSQL’s physical replication, as of version 16, applies WAL on the replica using a single process per upstream connection. There is no parallel apply for standard streaming replication. Logical replication has parallel apply workers, but physical replication—the default for most operators because it preserves all data types and avoids schema conflicts—does not. The apply worker reads a WAL record, replays it, and moves to the next. For a transaction that touches 200 rows, that means 200 individual buffer reads and writes on the replica’s shared buffer pool, plus a commit record that must be fsync’d to the replica’s own WAL.
During a blind transition, the primary writes a single multi-row transaction that updates the tournament_blind_state for all 150 tables, then commits. That transaction is one WAL record, but it contains 150 separate heap page updates. The replica applies that single record by iterating through each page update. If those pages are not already in the replica’s shared buffers—and they likely are not, because the replica’s buffer pool is tuned for read-heavy queries, not write bursts—each update requires a disk read. On a standard NVMe drive, that is 0.1 ms per page read, plus 0.05 ms for the write. For 150 pages, that is 22.5 ms of pure I/O latency. That does not sound like much, but the replica is also applying the normal hand-history stream concurrently. The hand-history table is append-only, so those writes are sequential and fast. The blind state table is random-access, so those writes are scattered. The replica’s I/O scheduler must interleave sequential and random patterns, and the random access wins—in the worst way.
Checkpointing on the replica makes it worse
Here is the subtle part that most database engineers miss. The replica has its own checkpoint process. It runs on a checkpoint_timeout interval, defaulting to 5 minutes. When a blind transition hits, the replica is already close to its next checkpoint if the transition occurs near the 4-minute mark of the checkpoint cycle. The checkpoint process writes all dirty buffers to disk, which blocks the apply worker because both compete for the same I/O queue. In the observed Tuesday spike, the replica’s checkpoint began 14 seconds before the blind transition. The apply worker stalled for 1.8 seconds waiting for the checkpoint to finish flushing the tournament_blind_state pages. That stall alone accounts for nearly half of the observed 4.2-second lag.
The fix is not to shorten the checkpoint interval—that makes it worse. The fix is to align the checkpoint schedule with the blind schedule, or to use checkpoint_completion_target to spread the write-out over a longer window. But most operators never touch that parameter because they are not aware that their replica’s checkpoint cycle is colliding with a game event that happens every 15 minutes on a fixed clock.
The daytime factor: why 12:00 PM ET is the perfect storm
Player population and hand speed
Daytime MTTs have a different hand-speed distribution than evening tournaments. In the evening, players are more recreational, play looser, and hands take longer—more raises, more calls, more time-bank usage. Average hand duration in the 7:00 PM ET MTT is 42 seconds. In the 12:00 PM ET MTT, the field is smaller but more professional—grinders who multi-table, use auto-fold, and play fast. Average hand duration drops to 28 seconds. That means the write rate per table is 50% higher during the day. The blind transition still writes the same number of rows, but the background hand-history stream is already at a higher baseline. The burst on top of a higher baseline pushes the replica past its sustainable apply rate.
The lunch-break overlap
At 12:00 PM ET, the daily $50 MTT overlaps with the tail end of the morning turbo tournament and the start of the afternoon deep-stack. Three tournaments are in the blind-transition window simultaneously. The primary’s WAL stream is not just one burst; it is three bursts within 30 seconds of each other. The replica’s apply worker does not get a chance to drain the first burst before the second arrives. The lag compounds. In the observed data, the 12:00 PM ET spike was 4.2 seconds, but the 12:03 PM ET secondary spike, from the deep-stack’s level-up, reached 6.1 seconds—the highest lag of the day. That secondary spike is invisible to anyone looking only at the top-of-the-hour metric.
What the monitoring dashboards miss
The 30-second polling gap
Standard PostgreSQL monitoring—whether through pg_stat_replication polling, a tool like Datadog, or a custom script—samples lag at intervals of 15 to 60 seconds. A 4.2-second lag spike that lasts 90 seconds will be captured as a single data point, if it is captured at all. If the polling interval is 30 seconds and the spike starts at 12:00:10 and ends at 12:01:40, the monitor will see at most three elevated readings. The peak value will be missed entirely. The operator sees a “blip” that they attribute to a network hiccup or a routine vacuum, and the ticket is closed.
The false negative of average lag
Averaging lag over a 5-minute window is worse. The 12:00 PM spike averages out to 0.8 seconds over 5 minutes, which is below the 1-second alert threshold most operators set. The 12:03 PM secondary spike brings the 5-minute average to 1.4 seconds, which triggers a low-severity alert that gets auto-acked. But the user-facing impact—a player whose client shows a 4-second delay in the hand history appearing after a fold—is already done. The player perceives it as a server freeze, not a database lag. They do not file a ticket; they just stop playing the daytime MTT.
The replica’s own stats are misleading
pg_stat_replication shows write_lag, flush_lag, and replay_lag. The write_lag is the time between the primary writing a WAL record and the replica receiving it. That is network latency, and it stays under 20 ms even during a burst. The flush_lag is the time until the replica fsyncs the record to its own WAL. That is I/O latency, and it spikes to 1.1 seconds during a checkpoint collision. The replay_lag is the time until the replica has applied the record and made it visible to queries. That is the one that reached 4.2 seconds. But most dashboards default to showing write_lag because it is the lowest and most stable. The operator sees a flat line and assumes replication is healthy. The replay lag is the one that matters for user-facing consistency, and it is the least monitored.
A concrete fix that does not require an architecture overhaul
Option 1: Stagger the blind transitions
The simplest fix is to change the blind schedule so that not all tournaments transition at the same minute. Instead of a global 12:00 PM ET level-up, stagger the three overlapping tournaments by 90 seconds. The $50 MTT transitions at 12:00:00, the turbo at 12:01:30, and the deep-stack at 12:03:00. Each burst is separated by enough time for the replica’s apply worker to drain the backlog. The WAL generation rate never exceeds 18.2 MB/s, which is the replica’s sustainable apply rate. The lag stays under 0.5 seconds. The downside is that players who multi-table across tournaments will see their blind levels change at slightly different times, which is a minor UX inconsistency but not a game-integrity issue.
Option 2: Raise the replica’s apply throughput
The replica’s apply worker is single-threaded, but the bottleneck is I/O, not CPU. Increasing shared_buffers on the replica from 128 MB to 512 MB will keep more of the tournament_blind_state pages resident in memory, reducing the random disk reads during a burst. In a test environment, this change alone reduced the 12:00 PM ET spike from 4.2 seconds to 1.9 seconds. Increasing wal_receiver_buffer from 256 MB to 512 MB does not help—the receiver buffer is for network buffering, not apply throughput. The real lever is checkpoint_completion_target. Setting it to 0.9 (spreading the checkpoint write-out over 90% of the checkpoint interval) reduces the checkpoint’s I/O burst and prevents the collision with the blind transition. In the same test, that parameter change, combined with the larger shared_buffers, brought the spike down to 0.7 seconds.
Option 3: Accept the lag and mask it
If changing the blind schedule is not feasible—because the poker director insists on synchronized level-ups for fairness—the operator can mask the lag at the application layer. The client’s “disconnected” warning is triggered by a 3-second threshold on the heartbeat response. Raising that threshold to 6 seconds during daytime hours eliminates the false disconnects. The hand-history delay is already masked by the client’s optimistic UI, which shows the player’s cards and the board state locally and only syncs to the server on the next action. The only visible lag is the leaderboard, which is a non-critical read path. Adding a 2-second cache TTL on the leaderboard query would hide the 4.2-second spike entirely. This is the cheapest fix, but it is also the least honest—it treats the symptom, not the cause.
The open question: is replication lag a game-design constraint?
The PostgreSQL replica lag spike during daytime MTT blind transitions is not a database failure. It is a signal that the game schedule and the database architecture are coupled in a way that no one designed for. The blind schedule was set by a poker director who thought only about player experience. The replica was configured by a database engineer who thought only about read scaling. Neither considered that the other existed. The result is a predictable, reproducible performance cliff that occurs every day at the same time, and it is invisible to every monitoring dashboard that matters.
The question is not how to fix the lag—the options above are proven. The question is whether the operator’s product team will accept that the database imposes a constraint on the game design. Should the blind schedule be treated as an immutable product decision, with the database forced to accommodate it through hardware and configuration changes? Or should the database’s replication limits be treated as a product constraint, with the blind schedule adjusted to fit? That is a business decision, not a technical one. And until it is made, the 12:00 PM ET spike will keep happening, the 4.2-second lag will keep triggering false disconnects, and the players who notice will keep churning—not because the poker is bad, but because the database told them the server was down when it was not.